Limits of current GPU accounting in OSG
GIL Report - May 2022
By Igor Sfiligoi, UCSD/SDSC
In collaboration with David Schultz, UW Madison
Executive summary
OSG currently accounts for GPU resources in “GPU chip hours” [1]. The GPUs are however not all the same, some are small and some are big; the science delivered from different models thus varies by an order of magnitude. Moreover, a single GPU could be shared between multiple jobs.
We thus propose that OSG starts treating GPUs similarly to CPUs, i.e., switches GPU-core-hours, like we do for CPUs.
Relative GPU performance
We measured the throughput of two IceCube workflows on the various GPUs provided by the Pacific Research Platform (PRP) [2]. IceCube is the major user of GPU resources in OSG, so we consider them reasonably representative. The two workflows represent the two extremes of their compute needs; the “oversize=1” is the most GPU-compute demanding and the “oversize=4” is the fastest, and thus has a significantly lower GPU-to-CPU needs.
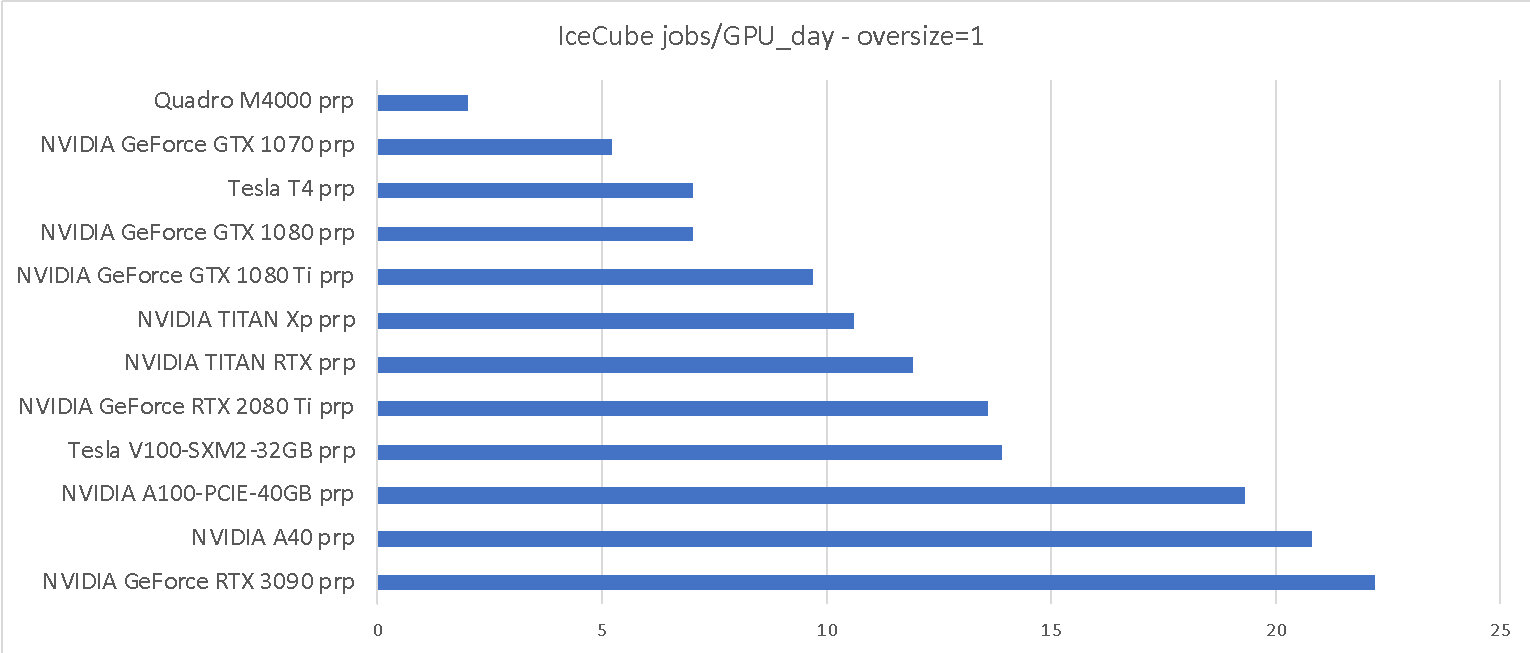
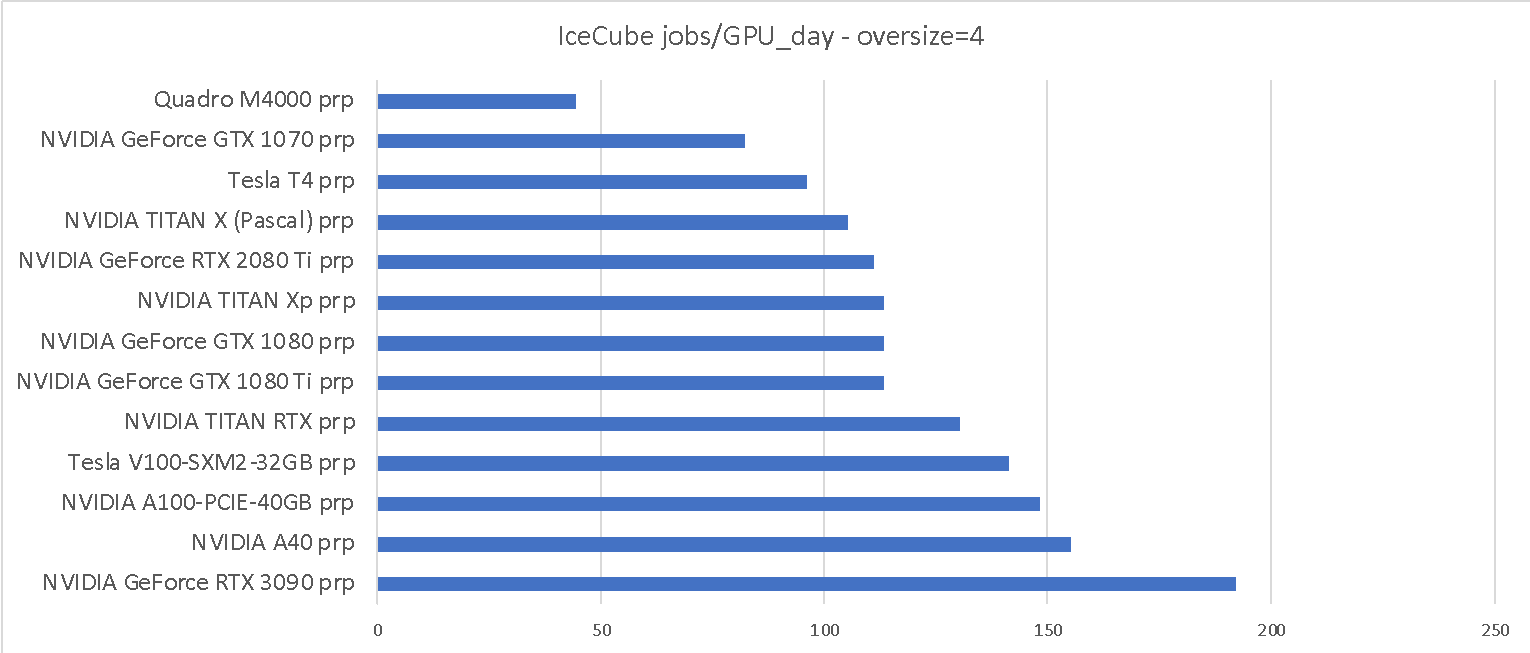
As can be seen from Table 1, when IceCube jobs can make full use of the GPU, there is over a 10x throughput difference between the slowest GPU, i.e. the Quadro M4000, and the fastest one, i.e. the RTX 3090. The “oversize=4” has a harder time making full use of the fastest GPUs, but the difference between the fastest and the slowest GPU is still almost 5x.
GPU sharing
For applications that have a hard time using a full GPU, like the IceCube “oversize=4” workflow on newer GPUs, it is desirable to share the GPU among multiple jobs.
Doing so at the user level, i.e. inside the jobs, is possible but not desirable. There are (at least) three ways that one can instead share a GPU at the infrastructure level:
- Inside the pilot, mapping multiple jobs to a single GPU at HTCondor level
- At resource provider level, e.g. at either batch or Kubernetes level
- At hardware level, currently only possible with A100 and A30 GPUs with MIG
Note that only the hardware level provides a high level of isolation between the jobs, but the other two methods still provide protection guarantees similar to those normally available when sharing a single CPU chip.
All three methods provide comparable throughput improvements and can be nested. For accounting purposes, all jobs would still report the use of a full GPU, although a pilot may annotate the resource with the level of sharing. Note that hardware sharing may be inferred, with enough knowledge about the hardware, while the level of sharing at the resource provider level may not be reliably detected.
HTCondor GPU sharing
The tested HTCondor Execute Point (EP), i.e. version 9.0.10, allows for easy sharing of GPUs between multiple jobs. This is achieved by reporting a multiple of the detected GPUs, by adding the following parameter to the HTCondor (EP) configuration (4x sharing):
GPU_DISCOVERY_EXTRA = $(GPU_DISCOVERY_EXTRA) -divide 4
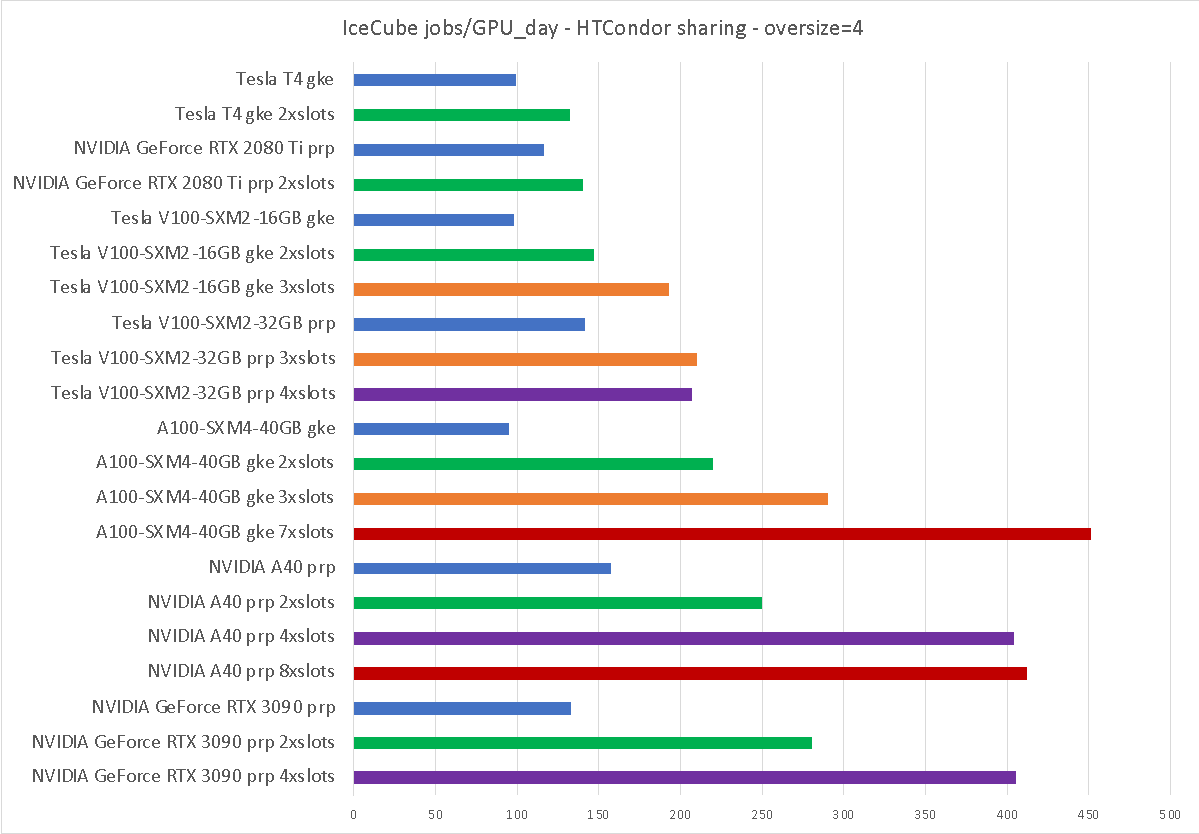
As can be seen, one can increase the science throughput by up to about 5x using this method.
Kubernetes GPU sharing
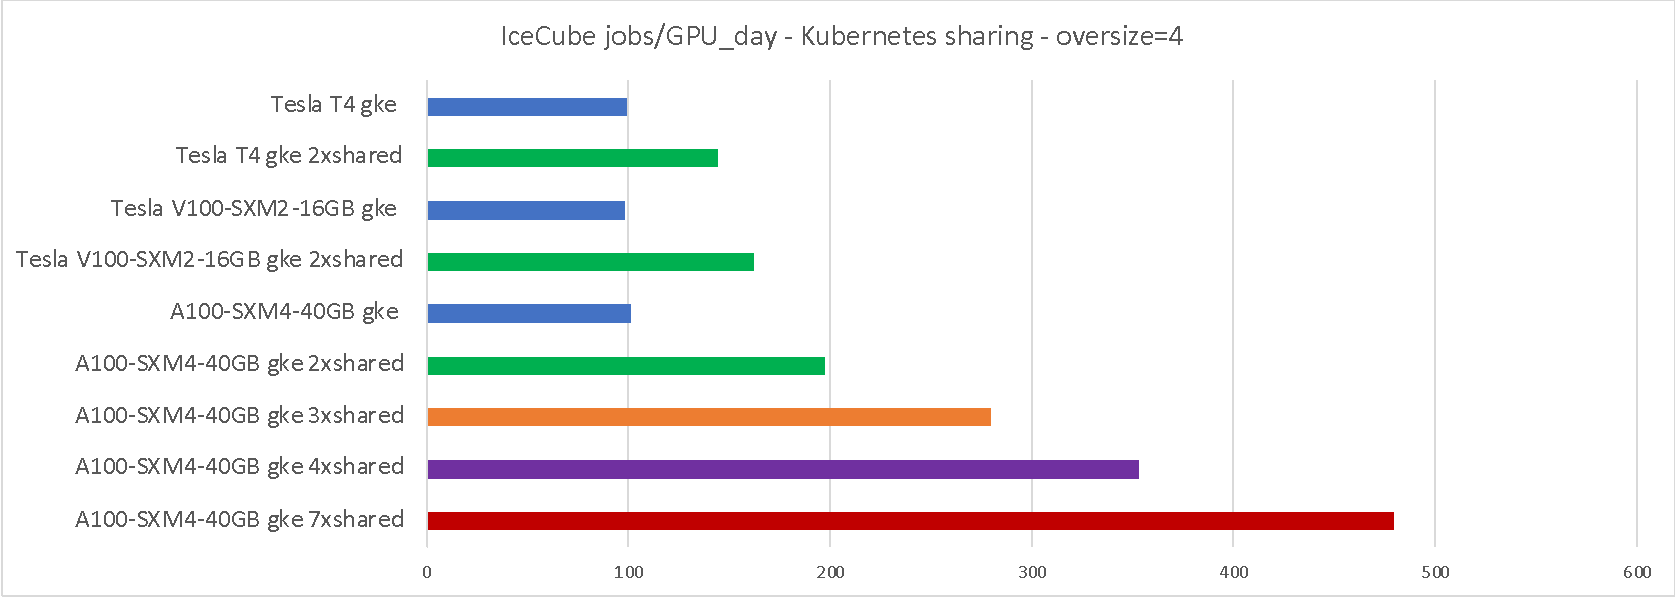
Google Kubernetes Engine [3] is adding the option of sharing the same GPU between multiple pods. The feature was still in limited-preview at the time of testing, but is expected to be generally available soon.
Due to the limited-preview nature of the setup, we are not presenting the configuration used, but we are allowed to present the benchmarking results. As can be seen in Table 4, the throughput improvement is comparable to HTCondor sharing.
Note that pilots were running inside Kubernetes and were not aware of the sharing.
Hardware partitioning of A100 GPU
The NVIDIA A100 GPU can be partitioned at a hardware level using Multi Instance GPU (MIG) [4].
We benchmarked the IceCube workloads on both full A100 and MIG-partitioned GPUs, on both PRP and GKE, and present the results below. As can be seen in Table 5, the throughput improvement is comparable to both HTCondor and Kubernetes sharing, although partitioning in less than 7 partitions results in 1/7th of the HW to be idled.
Note that the CPU driving the A100 GPU was very different on PRP and GKE:
- The PRP node had a high-frequency, low core count CPU:
- 8-Core, 3.2Ghz AMD EPYC 7252 Processor (serving 2 GPUs)
- The GKE node had a lower-frequency, higher core count CPU:
- 12-Core, 2.2 GHz AMD Intel Xeon (12 cores serving one GPU)
This difference explains why the throughput of IceCube jobs is so much different on the two systems when trying to use the whole GPU.
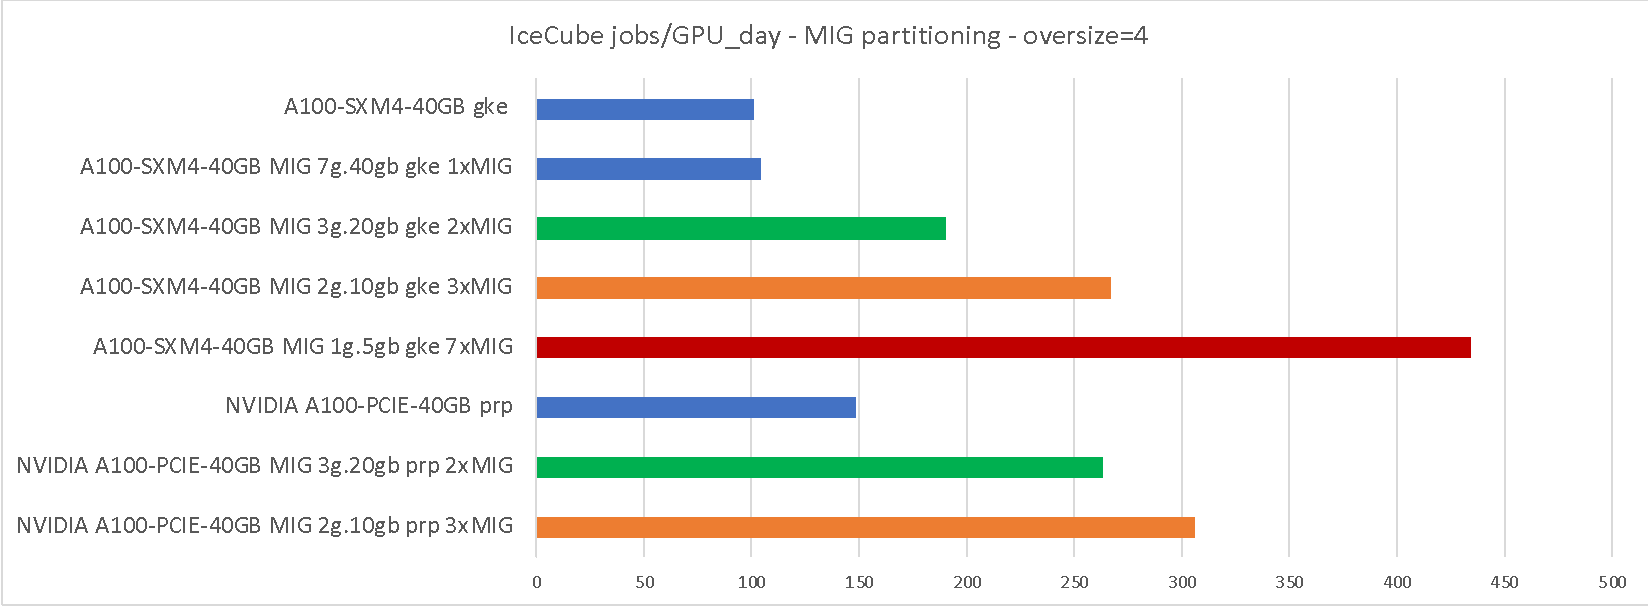

As shown in Table 6, even the GPU-intensive “oversize=1” workflow can benefit from MIG partitioning (and sharing in general), although only when a fast GPU is paired with slow, but plentiful CPU cores.
Possible GPU normalization strategies
IceCube has been internally using a GPU-normalization method that relies on the GPU model name, which is typically available in the HTCondor job history logs. (Note that A100 MIG model reporting is currently partially broken)
They maintain a lookup table from GPU model to relative performance, based on their own internal benchmark numbers [5].
A more general solution is to account the GPUs by the number of cores they provide (similarly to what is currently being done for CPUs) [6]. HTCondor natively does support the detection of GPU cores, but it is typically not enabled by default, but can be easily enabled at pilot level with:
GPU_DISCOVERY_EXTRA = $(GPU_DISCOVERY_EXTRA) -extra
As an example, we here report the core information of a few of the benchmarked GPUs:
# condor_gpu_discovery  -extra
CUDADeviceName="NVIDIA GeForce GTX 1070"
CUDAComputeUnits=15
CUDACoresPerCU=128
# condor_gpu_discovery  -extra
CUDADeviceName="NVIDIA GeForce GTX 1080"
CUDAComputeUnits=20
CUDACoresPerCU=128
# condor_gpu_discovery  -extra
CUDADeviceName="NVIDIA GeForce RTX 2080 Ti"
CUDAComputeUnits=68
CUDACoresPerCU=64
# condor_gpu_discovery  -extra
CUDADeviceName="Tesla V100-SXM2-32GB"
CUDAComputeUnits=80
CUDACoresPerCU=64
# condor_gpu_discovery  -extra
CUDADeviceName="NVIDIA A40"
CUDAComputeUnits=84
CUDACoresPerCU=128
# condor_gpu_discovery -extra
CUDADeviceName="NVIDIA GeForce RTX 3090"
CUDAComputeUnits=82
CUDACoresPerCU=128
# condor_gpu_discovery -extra
CUDADeviceName="A100-SXM4-40GB"
CUDAComputeUnits=108
CUDACoresPerCU=64
# condor_gpu_discovery  -extra
CUDADeviceName="NVIDIA A100-PCIE-40GB MIG 2g.10gb"
CUDAComputeUnits=28
# CUDACoresPerCU not reported in v9.0.10
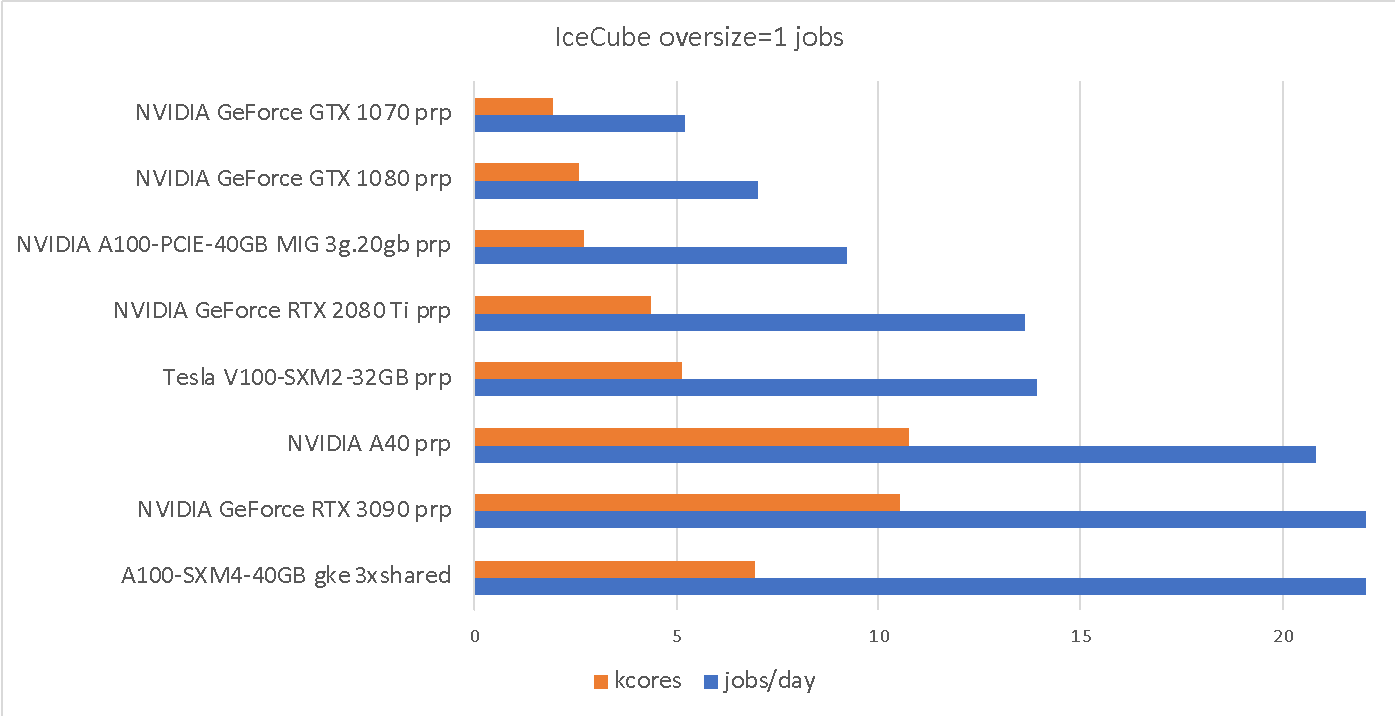
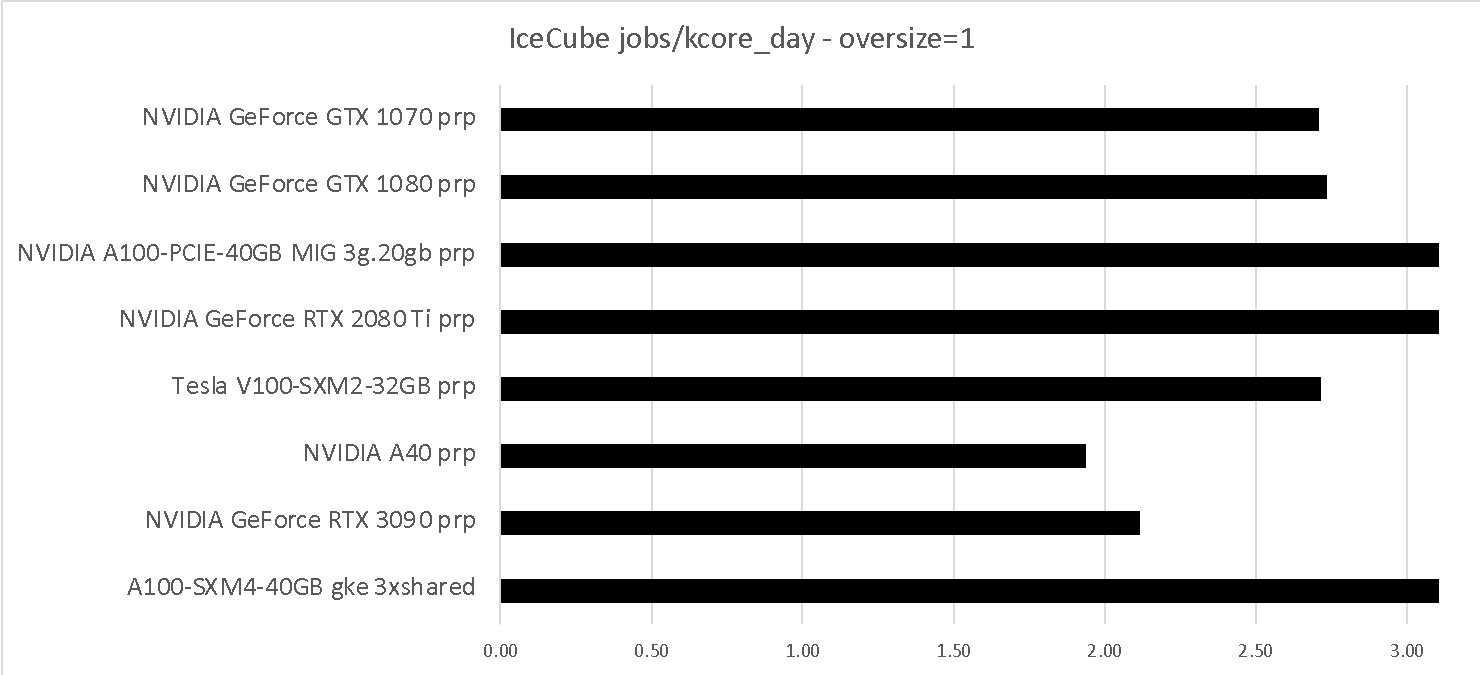
While Table 7 and Table 8 provide a comparison with IceCube “oversize=1” runtimes. As can be seen, the IceCube “oversize=1” throughput correlates reasonably well with the total number of GPU cores.
Note that neither solution directly accounts for sharing of GPU between jobs, which would need to be addressed independently. (But it does account for hardware GPU partitioning)
This could be easily addressed for the case where the pilot setups the sharing, e.g. as it could inject the sharing multiplier into the job classad and/or environment, or condor_gpu_discovery tool could be modified to report a reduced number of CUDAComputeUnits when sharing, as it already does for GPU memory.
A similar mechanism could be arranged with most of the resource providers, if we defined a standard mechanism for it.
Example HTCondor condor_gpu_discovery complete output, with and without sharing:
# condor_gpu_discovery  -extra #v9.0.10
DetectedGPUs="GPU-9831bd8f"
CUDACapability=6.1
CUDAClockMhz=1683.00
CUDAComputeUnits=15
CUDACoresPerCU=128
CUDADeviceName="NVIDIA GeForce GTX 1070"
CUDADevicePciBusId="0000:03:00.0"
CUDADeviceUuid="9831bd8f-0379-f705-b68d-cbba47c92251"
CUDADriverVersion=11.40
CUDAECCEnabled=false
CUDAGlobalMemoryMb=8120
CUDAMaxSupportedVersion=11040
# condor_gpu_discovery -extra
-divide 4 #v9.0.10
DetectedGPUs="GPU-9831bd8f, GPU-9831bd8f, GPU-9831bd8f, GPU-9831bd8f"
CUDACapability=6.1
CUDAClockMhz=1683.00
CUDAComputeUnits=15
CUDACoresPerCU=128
CUDADeviceMemoryMb=8120
CUDADeviceName="NVIDIA GeForce GTX 1070"
CUDADevicePciBusId="0000:03:00.0"
CUDADeviceUuid="9831bd8f-0379-f705-b68d-cbba47c92251"
CUDADriverVersion=11.40
CUDAECCEnabled=false
CUDAGlobalMemoryMb=2030
CUDAMaxSupportedVersion=11040
References
- GRACC- GPU Payload Jobs Summary, https://gracc.opensciencegrid.org/d/000000118/gpu-payload-jobs-summary
- Nautilus Documentation, https://ucsd-prp.gitlab.io
- Google Kubernetes Engine (GKE)https://cloud.google.com/kubernetes-engine
- NVIDIA Multi-Instance GPU User Guide, https://docs.nvidia.com/datacenter/tesla/mig-user-guide/
- WIPACrepo/monitoring-scripts/condor_utils.py GitHub, https://github.com/WIPACrepo/monitoring-scripts/blob/master/condor_utils.py#L436
- Sfiligoi et al. The anachronism of whole-GPU accounting. Accepted for publication at PEARC22. Pre-print https://doi.org/10.48550/arXiv.2205.09232
Acknowledgements
This work has been partially funded by the US National Science Foundation (NSF) Grants OAC-1826967, OAC-2030508, CNS-1925001, OAC-1841530, CNS-1730158, OAC-2112167, CNS-2100237 and CNS-2120019.
All Google Kubernetes Engine costs have been covered by Google-issued credits.
