Accounting of provisioned resources on OSG pool
GIL Report - August 2022
by Fabio Andrijauskas
In collaboration with Igor Sfiligoi, and Frank Wuerthwein University of California San Diego
HTCondor and Glidein Workflow Management System (GlideinWMS) are two of the tools that provide access to computational resources on the OSG pool. Our goal is to check the information about computational resource provisioning, based only on HTCondor and GlideinWMS. We postulate that resources available to OSG could be partitioned among the following eight categories, with the first six belonging to the pilot infrastructure. We are using the concept of the canonical time and the canonical unit:
“We propose to define it as ‘1 CPU core + 2 GB of RAM’ for CPU resources and ‘1 GPU chip’ for GPU resources. It can then be used to compute ‘canonical time’ in the same units as normal time. The ‘canonical unit’ and ‘canonical time’ definitions provide a measure of what is the smallest unit that is considered ‘true overhead’. For example, given the CPU definition of canonical unit of ‘1 CPU core and 2 GB of memory’, an hour when we have 3 CPU cores and 3 GB of memory unused would count as ‘1 CPU core hour’ (memory limited), the same period of 3 CPU cores and 1 GB of memory unused would count as ‘0 CPU core hours’ (memory limited), and the same period of 2 CPU cores and 6 GB of memory unused would count as ‘2 CPU core hours’ (CPU core limited)”
More information is available in Proposal for classifying the utilization of OSG and further on this document.
The objectives of this document, based on GlideinWMS and HTCondor, are:
- Compare what monitoring data is needed and what is currently available.
- Estimate the impact and effort needed to get to the desired monitoring setup.
- Provide a summary description of what steps are needed to reach the desired state.
To achieve these objectives, a methodology was created to categorize the impact (i.e., how useful the accounting of this metric will be), effort to implement these metrics, and specific implementation characteristics. We use these estimates to create an ordered list of the needed activities.
Regarding the impact of the new metric, we set 1 to 5 classifications, 1 is information that is only useful to a specific debug process, and this data could not indicate a significant problem on OSG pool, and 5 is the information that is useful to a debug, performance analysis, and about “hidden” issues, the impact number 5 is strategic information that could lead to the decision-making process. About the effort, we set 1 to 5 classifications, 1 is full-time equivalent (FTE) of a few days, and 5 is the FTE of months.
The present monitoring state is on the section: “current state overview” further in this document.
Recommendations
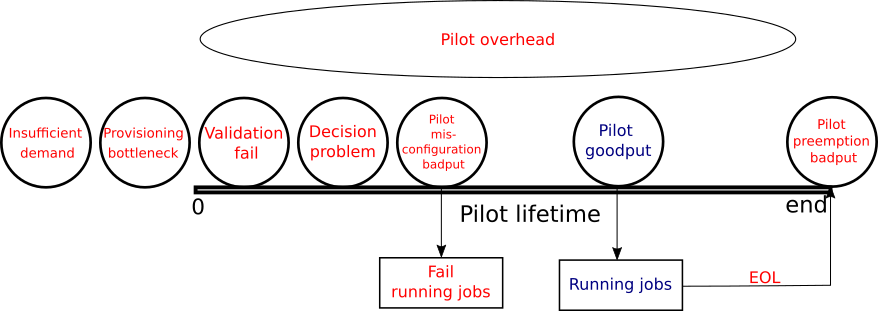
Figure 1 shows each utilization categories related describe in this document.
- Validation Fails: Any time spent by a pilot failed the initial validation (so the collector was never aware of it).
- Goal: We need a time series for the time of validation fails in canonical units.
- What we have: We currently have a time series of failed validation time in CPU hours, but not the equivalent time series in canonical units. The data needed for conversion from CPU hours to canonical hours is available when the time series is being created; it just need to be used.
- What we are missing: Information from when the pilot does not return any log files.
- Required information:
- Time of the pilot start and end: to validate the pilot’s validation start and calculate the time spent.
- Pilot validation starts time: to set the validation start time.
- Pilot validation end time: to set the end of the validation.
- Pilot validation status: to check what happens on the validation.
- CPU, GPU, disk, and memory requested by the pilot: to compute the canonical unit.
- Impact:
- Move to canonical unit: 5 (1 to 5, high is better)
- Deal with missing information: 2 (1 to 5, high is better)
- Required Effort:
- Move to canonical unit: 1 (1 to 5, low is better)
- Deal with missing information: 4 (1 to 5, low is better)
- Description for each information:
- Time of the pilot start and end: This information is available on GlideinWMS in a summarized format by the GlideinWMS module in entry/completed_jobs* on an XML file.
- Pilot validation starts time, pilot validation end time, and pilot status: this is calculated by the time used before starting the condor daemon. This information is available in a summarized with a time stamp in *entry/completed_jobs* on an XML file in GlideinWMS by summarization module.
- CPU, GPU, disk, and memory requested by the pilot: this information is on GlideinWMS in user_*/glidein_gfactory_instance/entry*/jobs* on a key/value text file.
- There are cases in which GlideinWMS is not able to get the HTCondor logs file to process the information. In this case, it is necessary to access the logs on the HTCondor nodes. This can be done by extending the Gratia probe or using the HTCondor Log central (a basic log control system on GNU/Linux with 6 months of logs).
- How to do it:
- Deal with missing information: Modify the existing summarization script to gather the timestamp, pilots’ validation status information for the completed_jobs* for each entry, and gather the computational resources from user_*/glidein_gfactory_instance/entry*/jobs* to create the time series for the time of validation fails (or using an external tool, Gratia or central log, when the information is not available)
- Move to canonical unit: Modify the existing summarization script to gather the computational resources (CPU, GPU, disk, and memory requested) from user_*/glidein_gfactory_instance/entry*/jobs* and calculate the canonical unit (“1 CPU core + 2 GB of RAM” for CPU resources and “1 GPU chip” for GPU resources to be used to compute “canonical time” in the same units as normal time.)
- Decision problem: Any time spent by a pilot that starts and registers with the collector but does not get any match before the pilot’s end of life (EOF).
- Goal: We need time series for the time of decision problem on a site in canonical units.
- What we have: We currently have time spent by the pilot on the schedule on GlideinWMS, but not the equivalent time series in canonical units. The data needed for conversion from CPU hours to canonical hours is available when the time series is being created; it just need to be used.
- What we are missing: Information from when the pilot does not return any information about the EOF.
- Required information:
- Time of the pilot star and end: to calculate the time spent.
- Pilot validation status: to check if the pilot did not have problems in the validation.
- Number of executed jobs on a pilot: to check the numbers of jobs.
- CPU, GPU, disk, and memory requested by the pilot: to compute the canonical unit.
- Impact:
- Move to canonical unit: 5 (1 to 5, high is better)
- Deal with missing information: 2 (1 to 5, high is better)
- Required Effort:
- Move to canonical unit: 1 (1 to 5, low is better)
- Deal with missing information: 3 (1 to 5, low is better)
- Description for each information:
- Time of the pilot start: This information is available on GlideinWMS statistics module in a summarized format in /var/log/gwms-factory/server/completed_jobs* on an XML file by GlideinWMS module.
- Pilot status: This information is available in a summarized with time stamp in *entry/completed_jobs* on an XML file on GlideinWMS.
- Time running of jobs on the pilot: This information is available in a summarized with time stamp in /var/log/gwms-factory/server/completed_jobs* on an XML file by GlideinWMS module.
- CPU, GPU, disk, and memory requested by the pilot: this information is on GlideinWSM in user_*/glidein_gfactory_instance/entry*/jobs* on a Key/Value text file.
- How to do it:
- Deal with missing information: Modify the existing summarization script to gather the timestamp and the running time of the jobs on completed_jobs* for each entry and gather the computational resources from user_*/glidein_gfactory_instance/entry*/jobs* to create the time series for the of decision problem used time on a site
- Move to canonical unit: Modify the existing summarization script to gather the computational resources (CPU, GPU, disk, and memory requested ) from user_*/glidein_gfactory_instance/entry*/jobs* and calculate the canonical unit (“1 CPU core + 2 GB of RAM” for CPU resources and “1 GPU chip” for GPU resources to be used to compute “canonical time” in the same units as normal time.)
- Pilot misconfiguration badput: Any time spent by a pilot running jobs that fail in the beginning due to a runtime problem not imputable to user errors.
- Goal: We need a time series for the time of Pilot misconfiguration badput in canonical units.
- What we have: We currently have a time series of running time of the jobs and the exit status are available on GlideinWMS but not the equivalent time series in canonical units. The data needed for conversion from CPU hours to canonical hours is available when the time series is being created; it just need to be used.
- What we are missing: Information from when the pilot does not return any log files or does not have information on logs related to the problem.
- Required information:
- Time of the pilot start and end: to calculate the time spend.
- Jobs exit status: to check what happen on the jobs.
- Pilot validation status: to check what happens on the validation
- CPU, GPU, disk, and memory requested by the pilot: to compute the canonical unit.
- Impact:
- Move to canonical unit: 5 (1 to 5, high is better)
- Deal with missing information: 4 (1 to 5, high is better)
- Required Effort:
- Move to canonical unit: 1 (1 to 5, low is better)
- Deal with missing information: 4 (1 to 5, low is better)
- Description for each information:
- Time of the pilot start and end and validation status: This information is available on GlideinWMS in a summarized format in /var/log/gwms-factory/server/completed_jobs* on an XML file by GlideinWMS module.
- Jobs exist Status, CPU, GPU, disk, and memory requested by the pilot: this information is on GlideinWSM in user_*/glidein_gfactory_instance/entry*/jobs* on a Key/Value text file.
- There are cases that which GlideinWMS is not able to get the HTCondor logs file to process the information, in this case, it is necessary to access the logs on the HTCondor nodes. This can be done extending the Gratia probe or using the HTCondor Log central (basic log control system on GNU/Linux with 6 months of logs).
- How to do it:
- Deal with missing information: Modify the existing summarization script to gather the timestamp, time of running jobs on completed_jobs* for each entry, and gather the computational resources from user_*/glidein_gfactory_instance/entry*/jobs* fails (or using an external tool, Gratia or central log, when the information is note available) and exit status to create the time series for the of pilot misconfiguration badput time.
- Move to canonical unit: Modify the existing summarization script to gather the computational resources (CPU, GPU, disk, and memory requested) from user_*/glidein_gfactory_instance/entry*/jobs* and calculate the canonical unit (“1 CPU core + 2 GB of RAM” for CPU resources and “1 GPU chip” for GPU resources to be used to compute “canonical time” in the same units as normal time.)
- Pilot goodput: Any time spent by a pilot running jobs that are complete.
- Goal: We need a time series for the time of pilot goodput in canonical units.
- What we have: We currently have a time series of goodput time; this data is available on GlideinWMS, but not the equivalent time series in canonical units. The data needed for conversion from CPU hours to canonical hours is available when the time series is being created; it just need to be used.
- What we are missing: none.
- Required information:
- Time of the pilot start and end: to calculate the time spend.
- Jobs exist Status: to check if is a good put.
- CPU, GPU, disk, and memory requested by the pilot: on a key/value text file to compute the canonical unit.
- Impact:
- Move to canonical unit: 5 (1 to 5, high is better)
- Deal with missing information: 5 (1 to 5, high is better)
- Required Effort:
- Move to canonical unit: 2 (1 to 5, low is better)
- Deal with missing information: 2 (1 to 5, low is better)
- Description for each information:
- Time of the pilot start and end: This information is available on GlideinWMS in a summarized format in /var/log/gwms-factory/server/completed_jobs* on an XML file.
- Jobs exist Status, CPU, GPU, disk, and memory requested by the pilot: this information is on GlideinWSM in user_/glidein_gfactory_instance/entry/jobs* on a Key/Value text file.
- How to do it:
- Deal with missing information: Modify the existing summarization script to gather the timestamp, time running of jobs on completed_jobs* for each entry and gather the computational resources from user_/glidein_gfactory_instance/entry/jobs and exit status to create the time series for the time of pilot goodput.
- Move to canonical unit: Modify the existing summarization script to gather the computational resources (CPU, GPU, disk, and memory requested) from user_/glidein_gfactory_instance/entry/jobs* and calculate the canonical unit (“1 CPU core + 2 GB of RAM” for CPU resources and “1 GPU chip” for GPU resources to be used to compute “canonical time” in the same units as normal time.)
- Pilot preemption badput: Any time spent by jobs that start running but do not finish because of the pilot termination (EOF).
- Goal: We need a time series for the time of Pilot preemption badput time used in canonical units.
- What we have: We currently have a time series of pilots until EOF (we can check the run time with the max time running or on nothing on a hard pilot kill); this data is available on GlideinWMS, but not the equivalent time series in canonical units. The data needed for conversion from CPU hours to canonical hours is available when the time series is being created; it just need to be used.
- What we are missing: Information from when the pilot does not return any information about the EOF.
- Required information:
- Time of the pilot start and end: to calculate the time spend.
- Jobs exist Status: to check if the pilots reach the EOF.
- CPU, GPU, disk, and memory requested by the pilot: on a key/value text file to compute the canonical unit.
- Impact:
- Move to canonical unit: 5 (1 to 5, high is better)
- Deal with missing information: 4 (1 to 5, high is better)
- Required Effort:
- Move to canonical unit: 1 (1 to 5, low is better)
- Deal with missing information: 3 (1 to 5, low is better)
- Description for each information:
- Time of the pilot start and end: This information is available on GlideinWMS in a summarized format in /var/log/gwms-factory/server/completed_jobs* on an XML file.
- Jobs exist Status, CPU, GPU, disk, and memory requested by the pilot: this information is on GlideinWSM in user_*/glidein_gfactory_instance/entry*/jobs* on a Key/Value text file.
- There are cases that which GlideinWMS is not able to get the HTCondor logs file to process the information, in this case, it is necessary to access the logs on the nodes and those logs based on the pilot information. This can be done extending the Gratia probe or using the HTCondor Log central. Or even estimate a EOF due a hard pilot kill.
- How to do it:
- Deal with missing information: Modify the existing summarization script to gather the timestamp, time of running jobs on completed_jobs* for each entry, and gather the computational resources from user_/glidein_gfactory_instance/entry/jobs* and exit status (or using an external tool, Gratia or central log, when the information is note available) to create the time series for the time of Pilot preemption badput
- Move to canonical unit: Modify the existing summarization script to gather the computational resources (CPU, GPU, disk, and memory requested ) from user_/glidein_gfactory_instance/entry/jobs* and calculate the canonical unit (“1 CPU core + 2 GB of RAM” for CPU resources and “1 GPU chip” for GPU resources to be used to compute “canonical time” in the same units as normal time.)
- Pilot overhead: Any pilot that starts at least one job or any canonical time spent not running any jobs is counted as pilot overhead. Any difference between “total time” and “canonical time” will instead be proportionally accounted to any jobs running at that time, if any.
- Goal: We need a time series for the time of pilot overhead time in canonical units.
- What we have: We currently have a time series data from all categories related to the pilot “waste,”; this data is available on GlideinWMS, but not the equivalent time series in canonical units. The data needed for conversion from CPU hours to canonical hours is available when the time series is being created; it just need to be used.
- What we are missing: none.
- Required information:
- Time of the pilot start and end: to calculate the time spend.
- Pilot validation starts time: to set the validation start time.
- Pilot validation end time: to set the end of the validation.
- CPU, GPU, disk, and memory requested by the pilot: on a key/value text file to compute the canonical unit.
- Measure process to start the jobs and others process inside the pilot: to calculate the overhead.
- Impact:
- Move to canonical unit: 5 (1 to 5, high is better)
- Deal with missing information: 3 (1 to 5, high is better)
- Required Effort:
- Move to canonical unit: 1 (1 to 5, low is better)
- Deal with missing information: 4 (1 to 5, low is better)
- Description for each information:
- Time of the pilot start and end: This information is available on GlideinWMS in a summarized format in /var/log/gwms-factory/server/completed_jobs* on an XML file.
- Pilot validation starts time, pilot validation end time, and pilot status: this is calculated by the time used before starting the condor daemon. This information is available in a summarized with time stamp in *entry/completed_jobs* on an XML file in GlideinWMS by summarization module.
- Jobs exist Status, CPU, GPU, disk, and memory requested by the pilot: this information is on GlideinWSM in user_*/glidein_gfactory_instance/entry*/jobs* on a Key/Value text file.
- Measure process to start the jobs and others process: add more measures on the pilot process.
- How to do it:
- Deal with missing information: Modify the existing summarization script to gather the timestamp, number of jobs on completed_jobs* for each entry, and gather the computational resources from user_*/glidein_gfactory_instance/entry*/jobs* and the difference between for the total time and validation time or baput (and other process) creating the time series for the number of pilot preemption overhead
- Move to canonical unit: Modify the existing summarization script to gather the computational resources (CPU, GPU, disk, and memory requested ) from user_*/glidein_gfactory_instance/entry*/jobs* and calculate the canonical unit (“1 CPU core + 2 GB of RAM” for CPU resources and “1 GPU chip” for GPU resources to be used to compute “canonical time” in the same units as normal time.)
There are two additional classifications of time available to OSG and not directly related to pilot infrastructure:
-
Provisioning bottleneck:
any time a resource provider, aka site, is idle because we did not send enough pilots, even though we had
user jobs waiting for resources.
- Goal: We need a time series for the time of Provisioning bottleneck
- What we have: We currently have status of the jobs on each scheduler in GlideinWMS (last snapshot only). The data needed for conversion from CPU hours to canonical hours is available when the time series is being created; it just need to be used.
- What we are missing: none.
-
Required information:
- Status of the jobs on each scheduler in GlideinWMS to check the number of idle jobs.
- Pilots sent for a site to check the number of pilots on a site (we currently have no information about that’s going on inside each CE).
- CPU, GPU, disk, and memory requested by the pilot: on a key/value text file to compute the canonical unit.
-
Impact:
- Move to canonical unit: 5 (1 to 5, high is better)
- Deal with missing information: 5 (1 to 5, high is better)
-
Required Effort:
- Move to canonical unit: 1 (1 to 5, low is better)
- Deal with missing information: 4 (1 to 5, low is better)
-
Description for each information:
- Status of the jobs and Pilots sent for a site: This information is available on GlideinWMS in a summarized format in /var/log/gwms-factory/server/completed_jobs* on an XML file
- Jobs exist Status, CPU, GPU, disk, and memory requested by the pilot: this information is on GlideinWSM in user_*/glidein_gfactory_instance/entry*/jobs* on a Key/Value text file.
-
How to do it:
- Deal with missing information: Create a script using python and information visualization library to gather the timestamp, number of jobs on completed_jobs* for each entry, and gather the computational resources from user_*/glidein_gfactory_instance/entry*/jobs* and the number of pilots on a site and the number of idle jobs on a site to create the time series of provision bottle neck.
- Move to canonical unit: Modify the existing summarization script to gather the computational resources (CPU, GPU, disk, and memory requested) from user_*/glidein_gfactory_instance/entry*/jobs* and calculate the canonical unit (“1 CPU core + 2 GB of RAM” for CPU resources and “1 GPU chip” for GPU resources to be used to compute “canonical time” in the same units as normal time.)
-
Insufficient demand:
any time a resource provider, aka site, sits idle because we did not send enough pilots. After all, no jobs are
waiting that can run on that resource.
- Goal: We need a time series for the time of Insufficient demand in canonical units.
- What we have: We currently have status of the jobs on each scheduler in GlideinWMS (last snapshot only). The data needed for conversion from CPU hours to canonical hours is available when the time series is being created; it just need to be used.
- What we are missing: none.
-
Required information:
- Status of the jobs on each scheduler in GlideinWMS to check the number of idle jobs.
- Pilots sent for a site to check the number of pilots on a site (we currently have no information about that’s going on inside each CE)
- CPU, GPU, disk, and memory requested by the pilot: on a key/value text file to compute the canonical unit.
-
Impact:
- Move to canonical unit: 5 (1 to 5, high is better)
- Deal with missing information: 5 (1 to 5, high is better)
-
Required Effort:
- Move to canonical unit: 1 (1 to 5, low is better)
- Deal with missing information: 2 (1 to 5, low is better)
-
Description for each information:
- Status of the jobs and Pilots sent for a site: This information is available on GlideinWMS in a summarized format in /var/log/gwms-factory/server/completed_jobs* on an XML file.
- Jobs exist Status, CPU, GPU, disk, and memory requested by the pilot: this information is on GlideinWSM in user_\*/glidein_gfactory_instance/entry\*/jobs* on a Key/Value text file.
-
How to do it:
- Deal with missing information: Create a script using python and information visualization library to gather the timestamp, number of jobs on completed_jobs* for each entry, and gather the computational resources from user_\*/glidein_gfactory_instance/entry\*/jobs* and the number of pilots on a site and the number of idle jobs on a site to create the time series insufficient demand on a site.
- Move to canonical unit: Modify the existing summarization script to gather the computational resources (CPU, GPU, disk, and memory requested) from user_\*/glidein_gfactory_instance/entry\*/jobs* and calculate the canonical unit (“1 CPU core + 2 GB of RAM” for CPU resources and “1 GPU chip” for GPU resources to be used to compute “canonical time” in the same units as normal time.)
The log retention of the GlideinWMS logs is controlled on /etc/gwms-factory/glideinWMS.xml, and this is the default value for the OSG installations:
<condor_logs max_days="14.0" max_mbytes="100.0" min_days="3.0"/>
<job_logs max_days="7.0" max_mbytes="100.0" min_days="3.0"/>
<summary_logs max_days="31.0" max_mbytes="100.0" min_days="3.0"/>
Actions items
Implementation order |
Category |
Impact |
Effort |
Integration |
|---|---|---|---|---|
1 |
Validation fails - Move to canonical unit |
5 |
1 |
With Decision problem |
2 |
Decision problem - Move to canonical unit |
5 |
1 |
With validations fails |
3 |
Pilot misconfiguration badput - Move to canonical unit |
5 |
1 |
none |
4 |
Provisioning bottleneck - Move to canonical unit |
5
|
1 |
With insufficient demand |
5 |
Insufficient demand - Move to canonical unit |
5
|
1 |
With provision bottleneck |
6 |
Pilot overhead - Move to canonical unit |
5 |
1 |
none |
7 |
Pilot preemption badput - Move to canonical unit |
5 |
1 |
none |
8 |
Pilot goodput - Move to canonical unit |
5
|
2
|
none |
9 |
Pilot goodput - Deal with missing information |
5 |
2 |
none |
10 |
Pilots list - Create a list of the current pilots from GlideinWMS |
5 |
2 |
none |
11 |
Insufficient demand - Deal with missing information |
5 |
2 |
With provision bottleneck |
12 |
Data retention - The retention periods for the currently available data should be increased and controlled in GlideinWMS and HTCondor. The amount of time to be stored should be enough for the information to be processed, considering the size on the current frontend and other (10TB is a good approximation). |
5 |
3 |
none |
13 |
Provisioning bottleneck - Deal with missing information: |
5 |
4 |
With insufficient demand |
14 |
Decision problem - Deal with missing information: |
2 |
3 |
With validations fails |
15 |
Validation fails - Deal with missing information |
2 |
4 |
With Decision problem |
16 |
Pilot preemption badput - Deal with missing information |
4 |
3 |
none |
17 |
Pilot misconfiguration badput - Deal with missing information: |
4 |
4 |
none |
18 |
Pilot overhead - Deal with missing information |
3 |
4 |
none |
Introduction – current state overview
Introduction
The Open Science Grid has a well-made system to access available resources. Figure 2 shows how HTCondor, and Glidein Workflow Management System (GlideinWMS) provide access to the computational resources [1].
![Figure 2: GlideinWMS for grid access with condor [2].]( /images/GIL/accounting_of_provisioned_resource_on_OSG_pool/image2.png)
Figure 2 shows the main idea is that when the Virtual Organization Frontend senses the demand for more resources, Condor job execution daemons (aka glidein pilots or pilots) are submitted to the grid by the Glidein Factory (GF) [5,6]. Figure 3 shows a simplified pilot’s lifetime and when each type of measure could or happens.
OSG Usage Classification
We postulated that the time of resources available to OSG could be partitioned among the following eight categories, with the first six belonging to the pilot infrastructure:
- Validation fails: Any time spent by a pilot failed the initial validation (so the collector was never aware of it).
- Decision problem: Any time spent by a pilot that starts and registers with the collector but does not get any match before the pilot’s end of life (EOF).
- Pilot misconfiguration badput: Any time spent by a pilot running jobs that fail in the beginning due to a runtime problem not imputable to user errors.
- Pilot goodput: Any time spent by a pilot running jobs that are completed.
- Pilot preemption badput: Any time spent by jobs that start running but do not finish because of the pilot termination (end of life).
- Pilot overhead: Any pilot that starts at least one job or any canonical time spent not running any jobs is counted as pilot overhead. Any difference between “total time” and “canonical time” will instead be proportionally accounted to any jobs running at that time, if any.
There are two additional classifications of time available to OSG and not directly related to pilot infrastructure:
- Provisioning bottleneck: any time a resource provider, aka site, is idle because we did not send enough pilots, even though we had user jobs waiting for resources.
- Insufficient demand: any time a resource provider, aka site, sits idle because we did not send enough pilots. After all, no jobs are waiting that can run on that resource.
Further clarification of “Pilot overhead” and canonical units
OSG jobs come with fine-grained requirements, while the pilots offer a fixed total number of CPU cores, GPUs, and memory, and there is no optimal way to maximize the use of all the resources while keeping job priorities in consideration. OSG thus allows for certain resources to be idle if some of the other equally important resources are fully utilized. For example, it is just as acceptable to “use all the CPU cores and only a fraction of the memory” as it is to “use all the memory and only a subset of the CPU cores”.
The “canonical unit” and “canonical time” definitions provide a measure of what is the smallest unit that is considered “true overhead”. We thus account “Pilot overhead” only in multiples of “canonical units.” For example, given the CPU definition of the canonical unit of “1 CPU core and 2 GB of memory”, an hour when we have 3 CPU cores and 3 GB of memory unused would count as “1 CPU core hour” (memory limited), the same period of 3 CPU cores and 1 GB of memory unused would count as “0 CPU core hours” (memory limited), and the same period of 2 CPU cores and 6 GB of memory unused would count as “2 CPU core hours” (CPU core limited).
The use of “canonical time” in “Pilot overhead” brings however an accounting problem; I.e. What to do with the remainder of the time that remains unaccounted for. Using the first example above, when we have 3 CPU cores and 3 GB of memory unused, we have a remainder of “2 CPU core hours”.
In order to fully account for all the resources, we thus account that remainder proportionally between any jobs that were running at that point in time. For example, if we had a remainder of 2 CPU cores (and any amount of memory) and there were two jobs running during the considered time period, say 1h for example simplicity, one which completed and one that never did due to the pilot getting preempted sometime in the future, we would account 1 CPU core hour to each of “Pilot goodput” and “Pilot preemption badput”. As a further clarification, any time the pilot does not run any jobs at all, all the time is accounted to “Pilot overhead”, even if it is not a multiple of “canonical time”.
Note that for GPU accounting “canonical time” is currently defined the same as “time”, i.e. “GPU chip hours”, so there is never any leftover there.
This document only provides the partitioned definitions of how the resources are being used. It does not aim to provide any guidance regarding how to classify the resource usage using the existing monitoring tools. As an example, it is currently unknown how to properly class (a) and (b) but one could speculate that one could approximate it by means of measuring period with no pilots waiting in the sites’ queues. Such clarifications and guidance are of course necessary but will be subject to a separate future document.
Actual Metrics and Data
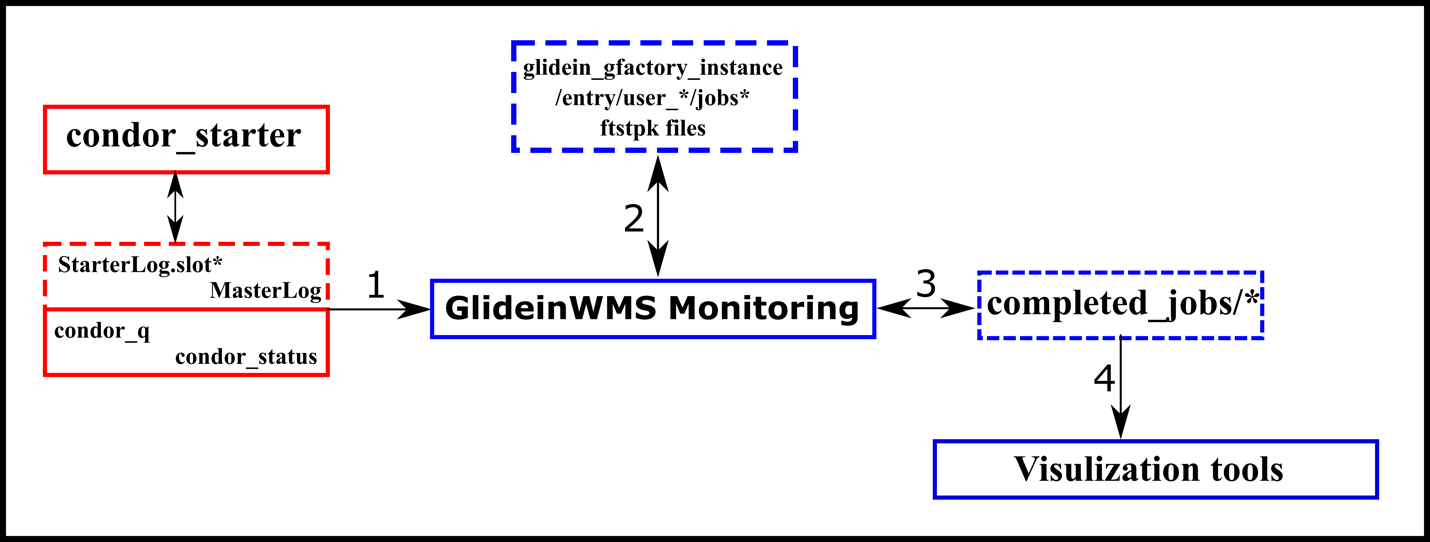
The HTCondor and GlideinWMS have tools to calculate how a pilot was performed based on several defined categories. All that information is provided by HTCondor and GlideinWMS tools and modules. Figure 4 shows how the information is processed; solid boxes are software/script, dashed boxes are data files, red boxes are information from HTCondor, and blue boxes are information from GlideinWMS.
Raw Information
In the first step, the monitoring from GlideinWMS fetches the StartedLog*.slot files from the HTCondor workers node, the permanence of these files is controlled for the HTCondor with the variable MAX_<SUBSYS>_LOG that controls the size of the logs (the default is 10 MB) and MAX_NUM_<SUBSYS>_LOG that controls the logs rotation (the default is two files) (where SUBSYS can be defined for STARTD to maintain the StartedLog*.slot ). Those files contain information about each job run, system process, and several pieces of information. Figure 5 shows an example of this data. In addition, some information is extracted from the condor_q and condor_status, such as the scheduler’s state of the job running.
07/29/19 15:38:54 (pid:2283431) Running job as user nobody
07/29/19 15:38:54 (pid:2283431) Create_Process succeeded, pid=2283501
07/29/19 16:01:41 (pid:2283431) Got SIGTERM. Performing graceful shutdown.
07/29/19 16:01:41 (pid:2283431) ShutdownGraceful all jobs.
07/29/19 16:01:42 (pid:2283431) Process exited, pid=2283501, status=0
07/29/19 16:01:42 (pid:2283431) error writing to named pipe: watchdog pipe has closed
07/29/19 16:01:42 (pid:2283431) LocalClient: error sending message to server
07/29/19 16:01:42 (pid:2283431) ProcFamilyClient: failed to start connection with ProcD
07/29/19 16:01:42 (pid:2283431) kill_family: ProcD communication error
07/29/19 16:01:42 (pid:2283431) waiting a second to allow the ProcD to be restarted
07/23/20 03:52:21 (pid:2356713) condor_starter (condor_STARTER) pid 2356713 EXITING WITH STATUS 0
07/27/20 11:16:18 (pid:2970490) I am: hostname: sdsc-81, fully qualified doman name: sdsc-81.t2.ucsd.edu, IP: 169.228.132.180, IPv4: 169.228.132.180, IPv6:
07/27/20 11:16:18 (pid:2970490) ** condor_starter (CONDOR_STARTER) STARTING UPTable 1 shows each field parsed from the HTCondor log file to GlideinWMS; this is the first step to building all the data gathering. The GlideinWMS uses an awk script to execute this task. The text format on the message is hardcoded on the HTCondor sources: condor_utils/condor_event.cpp, and condor_utils/status_string.cpp, src/condor_starter.V6.1/starter.cpp, and others C++ codes. HTCondor uses the same way to gather information, for example, on condor_who/who.cpp (condor_who) [8].
This information is kept using the log GNU/Linux system and the HTCondor configuration. The data is compiled and stored in the jobs* files to the next step by the monitoring module on GlideinWMS. Besides the fields in Table 1, there is more data such as the path to job input and output files, memory limits, information on file transfer, and others.
Table 1: Data from HTCondor logs
Measure |
Description |
Type |
Unit |
In GlideinWMS? |
|---|---|---|---|---|
Job ID |
Job ID from HTCondor |
Measured |
int |
Yes |
PID |
Process PID from the system |
Measured |
int |
No |
Exit Status |
Process exit status |
Measured |
int |
Yes |
Start Time |
The time when the job started |
Measured |
Date |
Yes |
End Time |
The time when the job ended |
Measured |
Date |
Yes |
Memory limits |
The soft and hard limits of memory usage in the job |
Measured |
int |
No |
Output and input files path |
Path for the input and output file of the job |
Propagated |
String |
No |
User used to run the job |
User on the system used to run the job |
Propagated |
String |
No |
Shadow daemon address |
Address for the shadow address |
Propagated |
String |
No |
File transfer file status |
If the files transfer was successful |
Propagated |
String |
No |
Machine submitted |
What machine submitted |
Propagated |
String |
No |
Limits resources status |
If the resource limits were successful |
Measured |
String |
No |
Local config source |
List of local files used |
Propagated |
String |
No |
Job niceness |
Priority of the process |
Measured |
int |
No |
Job universe |
Universe of the job |
Propagated |
String |
No |
Condor version information |
Information about the version HTCondor |
Propagated |
String |
No |
Type of logging information |
Type of logging set |
Propagated |
String |
No |
Factory instance for the job |
What instance of the factory is used in the job |
Propagated |
String |
No |
GLIDEIN_Job_Max_Time |
Max allowed time for the job to end. |
Propagated |
String |
No |
Another source of information is the startd_history* from HTCondor, the same environment variable controls these logs as starter logs, and GlideinWMS do not use all their data. Table 2 shows the fields that could be used for the monitoring. This information could be parsed, the command condor_history uses those files (src/condor_tools/history.cpp)
Table 2: Data from HTCondor logs the startd_history*
Measure |
Description |
Type |
Unit |
|---|---|---|---|
BadputCausedByDraining |
If the job was drained |
Measured |
Boolean |
ExitCode |
Exit code of the job |
Measured |
int |
Job_Site |
What site job was |
Measured |
String |
WhenToTransferOutput |
Show what time the output should be transfer |
Measured |
String |
ProvisionedResources |
What kind of resources are provided to the job |
Measured |
String |
LastRejMatchReason |
Last reason for the job rejection |
Measured |
String |
RemoteWallClockTime |
Cumulative number of seconds the job has been allocated a machine. This also includes time spent in suspension (if any), so the total real time spent running is |
Measured |
Int/seconds |
CondorVersion |
Condor version used by the job |
Measured |
Int |
CPUsUsage |
CpusUsage (Note the plural Cpus) is a floating point value that represents the number of cpu cores fully used over the lifetime of the job. |
Measured |
Int |
NumRestarts |
A count of the number of restarts from a checkpoint attempted by this job during its lifetime. |
Measured |
Int |
DiskUsage |
Amount of disk space (KiB) in the HTCondor execute directory on the execute machine that this job has used. |
Measured |
Int/kib |
RequestCpus |
The number of CPUs requested for this job. |
Measured |
Int |
LastJobStatus |
Last status of the job report |
Measured |
Int |
CpusProvisioned |
The number of Cpus allocated to the job. |
Measured |
Int |
RequestMemory |
The amount of memory space in MiB requested for this job. |
Measured |
Int |
DiskUsage_RAW |
Disk usage without any round up. |
Measured |
Int/KB |
RequestDisk |
Amount of disk space (KiB) in the HTCondor execute directory on the execute machine that this job has used. |
Measured |
Int/KB |
JobPrio |
Job priority |
Measured |
Int |
DESIRED_Sites |
Desired site of the job |
Measured |
String |
OnExitHold |
The job was in hold when exited |
Measured |
Boolean |
Owner |
User owner of the job |
Measured |
String |
JobDuration |
Job duration |
Measured |
Int/seconds |
MemoryProvisioned |
The amount of memory in MiB allocated to the job. |
Measured |
Int/MB |
TotalSubmitProcs |
Process used on this job |
Measured |
Int |
project_Name |
Name of the project related to this job |
Measured |
String |
JobPid |
Job ID |
Measured |
Int |
CompletionDate |
Job end date |
Measured |
Date |
ClusterId |
Id of cluster |
Measured |
Int |
MemoryUsage |
An integer expression in units of Mbytes that represents the peak memory usage for the job |
Measured |
String |
We have another source of information on the central logs from HTCondor OSG worker nodes, with 197GB space, with data from January 2022. Again, there is no time limitation for this information, only storage limitation; we can hold six months of data using a simple projection. There is information about the job and worker nodes from the OSG pool referring to startd_history; Figure 7 shows an example of that information. Table 2 shows several files present on those files.
<149>1 2022-01-28T00:23:36.804Z petes-36 condor_starter 15883 - [cat="D_ALWAYS" slot="slot1_1" GLIDEIN_ResourceName="SLATE_US_NMSU_AGGIE_GRID" GLIDEIN_Site="SLATE_US_NMSU_AGGIE_GRID" GLIDEIN_Name="glidein_24261_217254492"] Failed to send job exit status to shadow
<149>1 2022-01-28T02:23:46.524Z CRUSH-OSG-C7-10-5-159-89 condor_starter 83403 - [cat="D_ALWAYS" slot="slot1" GLIDEIN_ResourceName="SU-ITS-CE2" GLIDEIN_Site="SU-ITS" GLIDEIN_Name="glidein_2_616735772"] Failed to send job exit status to shadow
<149>1 2022-01-28T00:23:49.433Z petes-12 condor_starter 8804 - [cat="D_ALWAYS" slot="slot1_1" GLIDEIN_ResourceName="SLATE_US_NMSU_AGGIE_GRID" GLIDEIN_Site="SLATE_US_NMSU_AGGIE_GRID" GLIDEIN_Name="glidein_16655_31815432"] Failed to send job exit status to shadow
<149>1 2022-01-28T07:25:06.871Z 25acf9a90275 condor_starter 263213 - [cat="D_ALWAYS" slot="slot1_5" GLIDEIN_ResourceName="TACC-Jetstream-Backfill" GLIDEIN_Site="Texas Advanced Computing Center"] Failed to send job exit status to shadow
<29>1 2022-01-28T07:51:03.430Z osgvo-docker-pilot-5c5bcb9885-tsgts supervisord 1 - [level="INFO" GLIDEIN_ResourceName="TIGER-OSG-BACKFILL-PROD" GLIDEIN_Site="CHTC"] exited: condor_master (exit status 0; expected)
<157>1 2022-01-28T02:00:13.800588-06:00 compute-1-11 glidein_stderr - - [GLIDEIN_ResourceName="IIT_CE1" GLIDEIN_Site="IIT" GLIDEIN_Name="glidein_10386_583716042"] FATAL:   Unable to handle docker://hub.opensciencegrid.org/library/alpine:3 uri: while building SIF from layers: unable to create new build: while ensuring correct compression algorithm: while creating squashfs: create command failed: exit status 1: FATAL ERROR:Failed to create thread
<29>1 2022-01-28T08:21:11.555Z osgvo-docker-pilot-5c5bcb9885-tsgts supervisord 1 - [level="INFO" GLIDEIN_ResourceName="TIGER-OSG-BACKFILL-PROD" GLIDEIN_Site="CHTC"] exited: condor_master (exit status 0; expected)Summarization of the data usage
We have information about each job on HTCondor related to the user on the GlideinWMS on user_*/glidein_gfactory_instance/entry*/jobs* 4. It is possible to see several data that could be used to check each usage classification category; Figure 8 shows one example of how the information is presented on the files. On the jobs, we have information related to the pilots, such as the validation process and the site’s information. Using the gfactory-2.opensciencegrid.org as an example, we have (/var/log/gwms-factory/client) 213912 jobs.out at one specific moment. The data is kept for seven days or less due to a storage limitation (which can be configured):
- Only 7748, 3%, output files do not have any metric information; the files are incomplete.
- 15673 files, 8%, have the metric XML area, but any of the metrics are shown in Figure 8 due to a failure on the pilot.
<status>OK</status>
    <metric name=”AutoShutdown” ts=”2022-02-28T22:42:54-08:00” uri=”local”>True</metric>
    <metric name=”CondorDuration” ts=”2022-02-28T22:42:54-08:00” uri=”local”>169993</metric>
    <metric name=”TotalJobsNr” ts=”2022-02-28T22:42:54-08:00” uri=”local”>31</metric>
    <metric name=”TotalJobsTime” ts=”2022-02-28T22:42:54-08:00” uri=”local”>133428</metric>
    <metric name=”goodZJobsNr” ts=”2022-02-28T22:42:54-08:00” uri=”local”>7</metric>
    <metric name=”goodZJobsTime” ts=”2022-02-28T22:42:54-08:00” uri=”local”>4448</metric>
    <metric name=”goodNZJobsNr” ts=”2022-02-28T22:42:54-08:00” uri=”local”>23</metric>
    <metric name=”goodNZJobsTime” ts=”2022-02-28T22:42:54-08:00” uri=”local”>109782</metric>
    <metric name=”badSignalJobsNr” ts=”2022-02-28T22:42:54-08:00” uri=”local”>1</metric>
    <metric name=”badSignalJobsTime” ts=”2022-02-28T22:42:54-08:00” uri=”local”>19198</metric>
    <metric name=”badOtherJobsNr” ts=”2022-02-28T22:42:54-08:00” uri=”local”>0</metric>
    <metric name=”badOtherJobsTime” ts=”2022-02-28T22:42:54-08:00” uri=”local”>0</metric>
    <metric name=”CondorKilled” ts=”2022-02-28T22:42:54-08:00” uri=”local”>False</metric>
</result>We checked the source code to ensure the meaning for each field. Table 3 shows the description for each field. Some available metrics propagated from HTCondor, and others are measured.
Table 3: Description for each field from user_*/glidein_gfactory_instance/entry*/jobs*.
Measure |
Description |
Type |
Unit |
AutoShutdown |
If the daemon will gracefully shut itself down |
Propagated |
Boolean |
CondorDuration |
Time in seconds for the Condor execution |
Measured |
Seconds |
TotalJobsNr |
Number of jobs in the pilot |
Measured |
Jobs |
TotalJobsTime |
Total time of the jobs |
Measured |
Seconds |
goodZJobsNr |
Number of jobs terminated exit 0 |
Measured |
Jobs |
goodZJobsTime |
Time of jobs exit with signal 0 |
Measured |
Seconds |
goodNZJobsNr |
Number of jobs that report any termination signal different than 0 (without “dying”). |
Measured |
Jobs |
goodNZJobsTime |
Time used by jobs that report any termination signal different than 0. (without “dying”). . |
Measured |
Seconds |
badSignalJobsNr |
Number of jobs that end abnormally with signal different than 0. |
Measured |
Seconds |
badSignalJobsTime |
Time of jobs that end abnormally with signal different than 0 |
Measured |
Seconds |
badOtherJobsNr |
Number of jobs that end abnormally without a signal. |
Measured |
Jobs |
badOtherJobsTime |
Time of jobs that end abnormally without a signal. |
Measured |
Seconds |
CondorKilled |
If the condor demon was killed |
Propagated |
Boolean |
On the completed_jobs_*.log, we have a compilation of the user_*/glidein_gfactory_instance/entry*/jobs* creating more directed information grouping the job per pilot; completed jobs are augmented with data from the log. Figure 9 shows the collection of this information. Using the gfactory-2.opensciencegrid.org have as an example, we have 5322 files on the /var/log/gwms-factory/server/completed_jobs* on a specific date. The files are kept for 31 days by configuration or less due to a limitation on storage:
- All the files have some statistical information; there is no empty data on the files.
- When the “condor_started” is “False,” validation and the badput time are the same.
- There are files with “duration=-1” when the pilots have no jobs.
<job terminated="2022-02-09T05:55:38-08:00" client="fermilab_okd_gpfe01_frontend" username="fefermilab" id="6767402.000" duration="1359" condor_started="True" condor_duration="1266"><user jobsnr="0" duration="0" goodput="0" terminated="0"/><wastemill validation="66" idle="1000" nosuccess="0" badput="1000"/></job>To ensure the meaning for each field was necessary to check the GlideinWMS source code. Table 4 shows the description for each field. Some of those measures are related to a problem or error on the pilots, leading to a Measured/Estimated state.
Table 4: Description of fields on the completed_jobs_*
Measure |
Description |
Type |
Unit/type |
|---|---|---|---|
job terminated |
Data for end of the job |
Measured |
Date |
client |
Client from the frontend responsible for the pilot |
Propagated |
String |
username |
Username on the Factory responsible for the pilot |
Propagated |
String |
id |
ID of the pilot (this is not the job ID) |
Propagated |
int |
duration |
Duration of the pilot |
Measured |
Seconds |
condor_started |
If the HTCondor daemon has been started |
Propagated |
Boolean |
condor_duration |
Time in seconds for the Condor execution |
Propagated |
Seconds |
User - jobsnr |
User jobs per on pilot |
Measured |
Jobs |
User - duration |
User jobs duration on pilot |
Measured |
Jobs |
User - goodput |
User jobs with good put |
Measured |
Jobs |
User - terminated |
User jobs terminated |
Measured/ Estimated |
Jobs |
wastemill - validation |
Time used with pilot validation |
Measured |
Seconds |
wastemill - idle |
Time wasted on idle |
Measured |
Seconds |
wastemill - nosuccess |
Time with jobs with no success (non-zero or other reason) |
Measured/ Estimated |
Seconds |
wastemill - badput |
Time used with badput |
Measured/ Estimated |
Seconds |
RRD Files and data retention
On GlideinWMS we have Round Robin Database (RRD) files created to be used by the web interface, which contains information about the cores, pilots, and several other information. The process to generate this file is based on the information provided by the logs from HTCondor and statistics from GlideinWMS. The information of each RRD file is kept for up to one year. On the GlideinWMS is created a dictionary with jobs, pilots, and frontends, and all this information is compiled and presented in a web interface.
Regarding the data retention, the GlideinWMS says all the raw data are kept only for seven days (from HTCondor, Frontend, and Factory), and the RRD files are the historical information and kept for up to one year. The documentation is aligned with the source code, and this represents the opportunity to review this process and create a new way to store and process all the monitoring information.
Appendix – Available Tools
As a result of the pipeline of monitoring data, it is possible to gather several statistics, as seen in Figure 10 as an output of the analyze_entries script. For example, in Figure 10, it is possible to see some information about the time used, validation, wasted, and other information related to the categories for OSG usage classification.
frontend_UCSDCMS_cmspilot:


Glideins: 5192 - 13.3% of total
Jobs: 2970 (Avg jobs/glidein: 0.57, avg job len: 2.93h)

time:             43.0M ( 11.9K hours - 497.7 slots)
time used:        31.3M (  8.7K hours - 362.8 slots - 72%)
time validating: 719.0K ( 199.7 hours -   8.3 slots -  1%)
time idle:        10.4M (  2.9K hours - 120.9 slots - 24%)
time wasted:      11.7M (  3.2K hours - 134.9 slots - 27%)
badput:           19.6M (  5.5K hours - 227.3 slots - 45%)
Time used/time wasted: 2.7
Time efficiency: 0.73  Goodput fraction: 0.54R
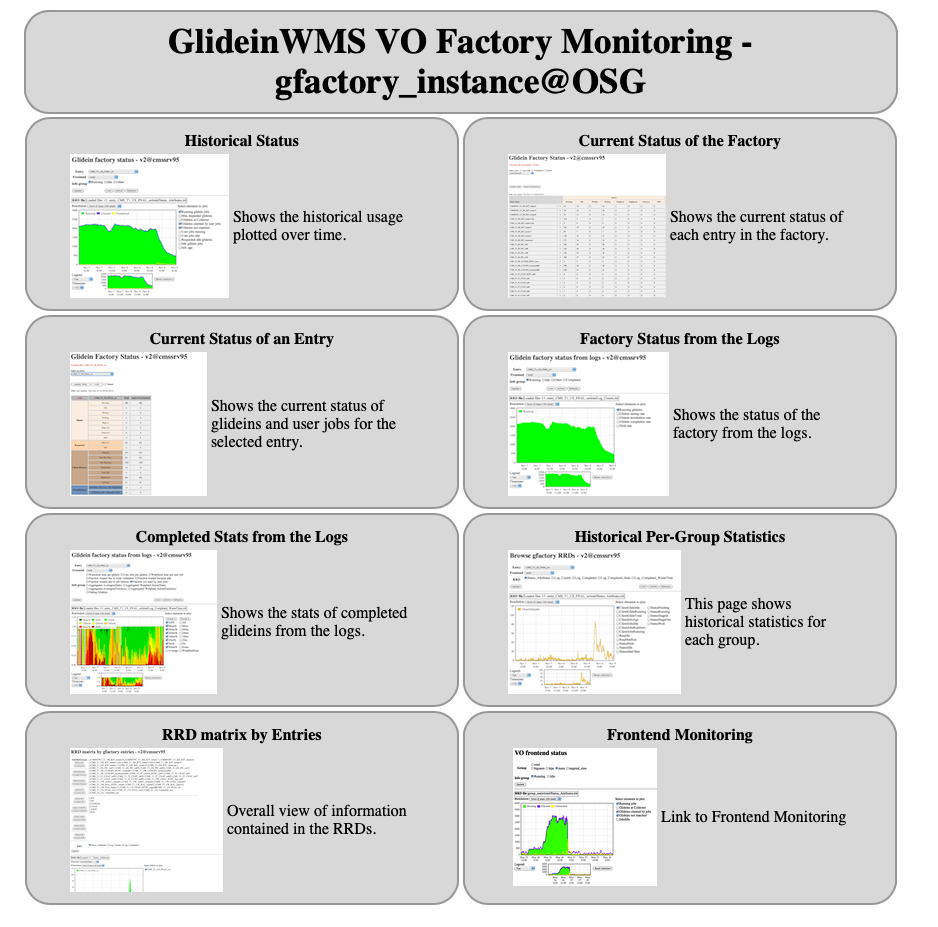
Another source of information is the Round Robin Database (RRD) files generated on the GlideinWMS monitoring module to show the time series on the factory monitor, as an example is possible to see on http://gfactory-2.opensciencegrid.org/factory/monitor/ the documentation and the Factory, the information is retained for one year. There are several forms of data visualization: historical status, status for each entry or factory, monitor for the frontend, and other visualization types. Figure 11 shows all the possibilities of data visualization.
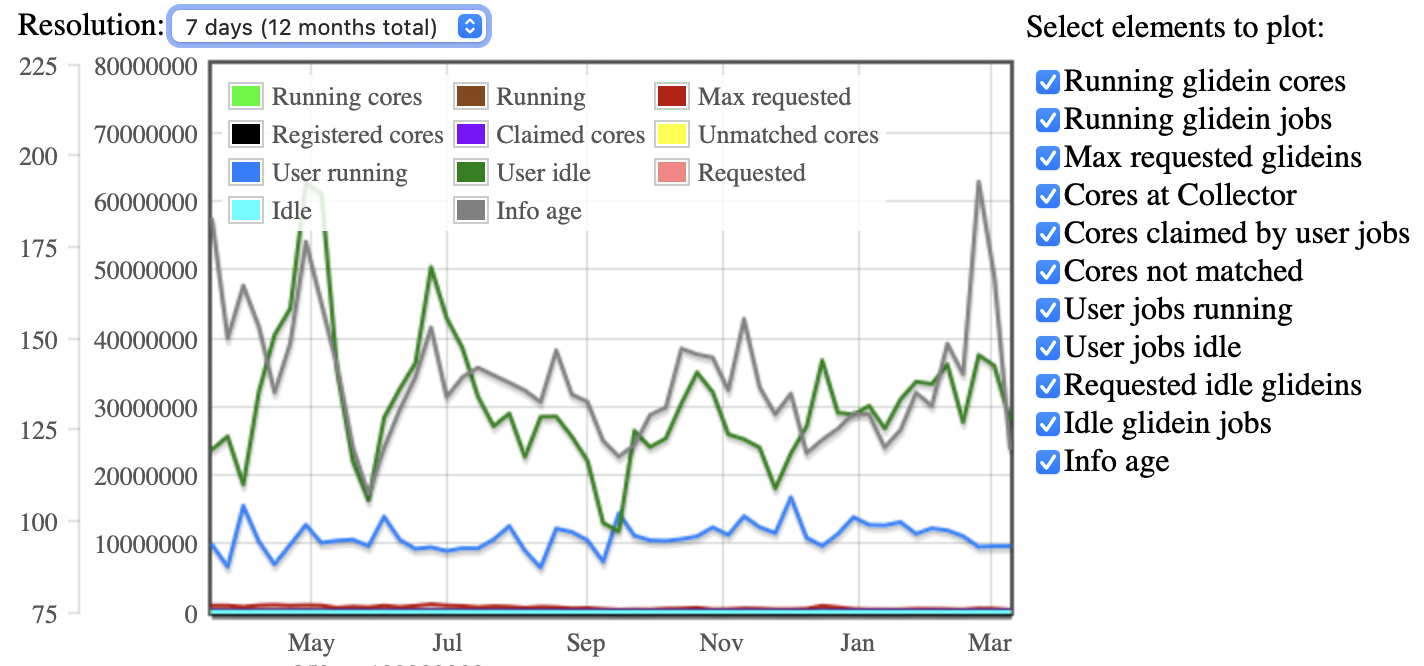
On the Historical status, it is possible to check information of the Glidein and the cores used: Running glidein cores, running glidein jobs, Max requested glideins, Cores at Collector, Cores claimed by user jobs, Cores not matched, User jobs running, User jobs idle, Requested idle glideins, Idle glidein jobs, and, Info age. Figure 12 shows one example of the information possible to achieve for each entry and frontend.
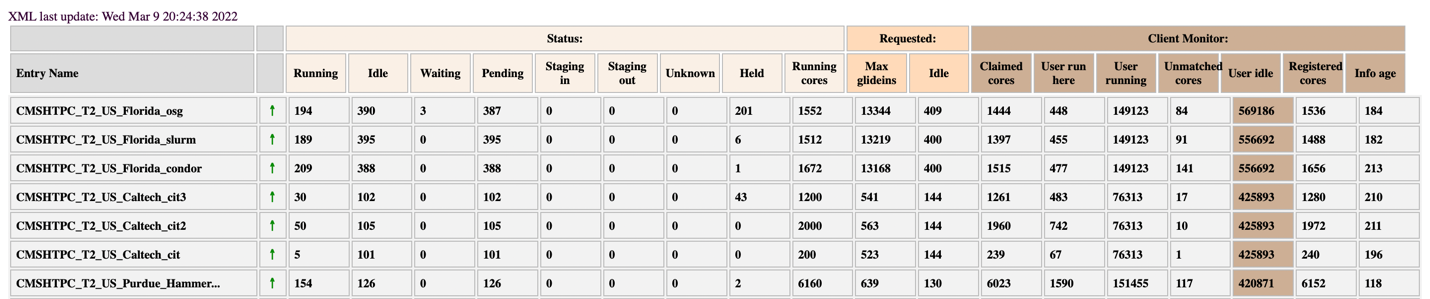
The status visualization shows more information about each entry; Figure 13 shows how the information is presented.
- Status: Running Idle, Waiting, Pending, Staging in, Staging out, Unknown Held, and, Running cores.
- Requested: Max glideins and Idle.
- Client Monitor: Claimed cores, User run here, User running, Unmatched cores, User idle, Registered cores, and, Info age.
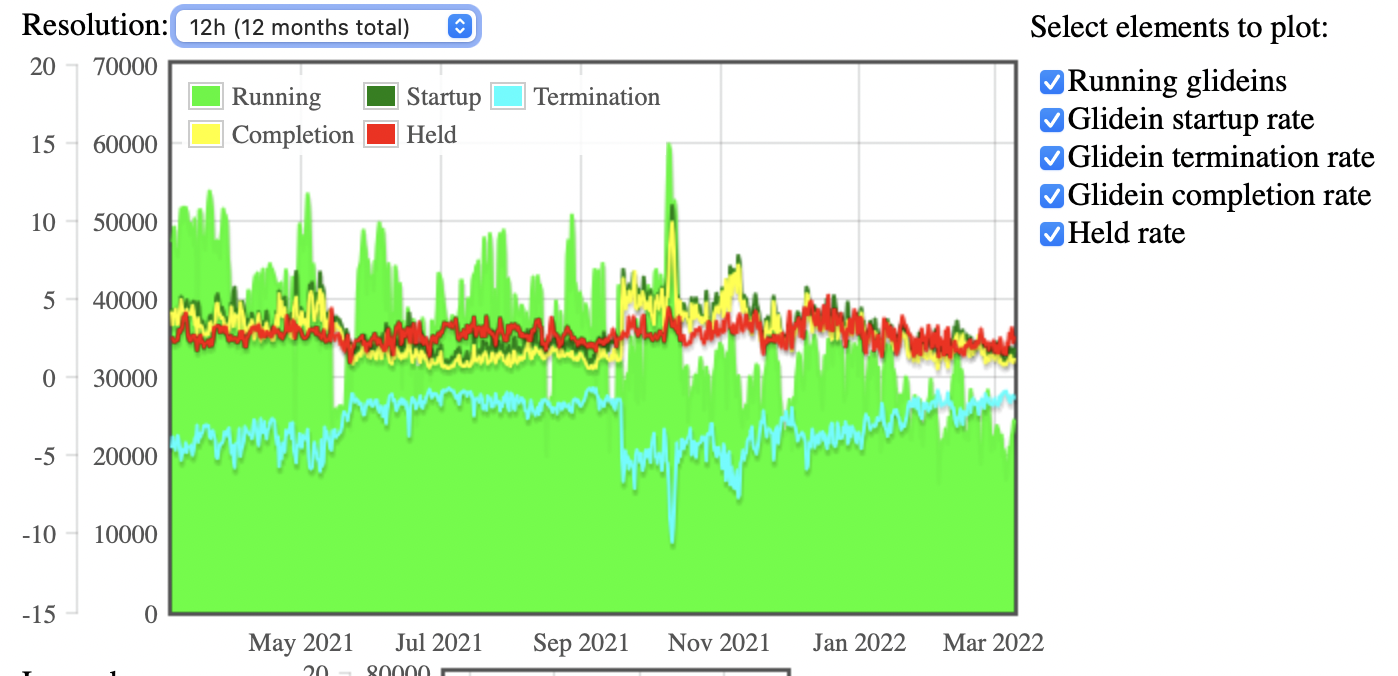
Other valuable information is on current logs information; Figure 14 shows how the information is presented: Running glideins, Glidein startup rate, Glidein termination rate, Glidein completion rate, and, Held rate.
References
[1] I Sfiligoi. Glideinwms—a generic pilot-based workload management system. Journal of Physics: Conference Series, 119(6):062044, 2008.
[2] D Bradley, I Sfiligoi, S Padhi, J Frey, and T Tannenbaum. Scalability and interoperability within glideinwms. Journal of Physics: Conference Series, 219(6):062036, 2010.
[3] https://htcondor.readthedocs.io/en/feature/
[4] https://glideinwms.fnal.gov/doc.prd/index.html
[5] I. Sfiligoi, D. C. Bradley, B. Holzman, P. Mhashilkar, S. Padhi, and F. Wurthwein, “The Pilot Way to Grid Resources Using glideinWMS,” 2009 WRI World Congress on Computer Science and Information Engineering, 2009, pp. 428-432, DOI: 10.1109/CSIE.2009.950.
[6] Zvada, M., Benjamin, D., & Sfiligoi, I. (2010). CDF GlideinWMS usage in Grid computing of high energy physics. Journal of Physics: Conference Series, 219(6), 062031. doi:10.1088/1742-6596/219/6/062031
[7] https://github.com/glideinWMS/glideinwms
[8] https://github.com/htcondor/htcondor